An Overview of Artificial Intelligence Concepts
by LJ Bubb

Explaining AI presents a comprehensive and accessible overview of the inner workings of AI without assuming any knowledge of mathematics or software. Machine learning is explained from first principles in a readable style, followed by a description of the core neural network algorithm that is powering many of the latest and most impressive AI demonstrations. These foundations are built on to illuminate in detail the mechanisms underpinning the seemingly magical generative techniques that produce photorealistic images from prompts and the Large Language Models (LLMs) forming the basis of chatbots like ChatGPT. The general methods by which AI systems are constructed are discussed, the decisions that need to be taken and the use cases to which the technology can be applied. Whether you are a manager of an AI team looking for more insight into the machine learning development process or are just curious as to how these systems work, then this is the book for you.
Say we want to persuade a machine to tell the difference between elephants and mice, a problem called “classification”. The first thing that needs to be done is to determine some factors that might reliably differentiate one animal from the other. Perhaps the heights and weights of the animals may be chosen. These are factors that can be easily measured and sound in theory as if they might result in metrics that are quite distinct for each type of animal. It would be anticipated that the heights and weights of elephants and mice are quite different.
We don’t have to choose only height and weight. As many factors as we like can be collected. You can use your intuition about which factors could be relevant to the task and the assumptions do not necessarily need to be correct. If you went with the number of eyes and it turns out elephants and mice both have exactly two eyes, it doesn’t matter as our machine learning system will automatically figure out that number of eyes isn’t a very useful way of telling the animals apart. You will need to have guessed some factors that are relevant to the task somewhere in the mix, but you don’t need to know exactly which factors are important.
We might start our quest for AI with a brainstorming session, asking people who are experts in the field to use their experience to throw out ideas regarding which factors might be significant. The next thing we need to do is collect some “training” examples for the system to learn from. That is, real world measurements of elephants and mice are taken and the heights and weights are recorded in a table.
| Height (cm) | Weight (kg) | Animal |
|---|---|---|
| 330 | 4937 | Elephant |
| 4.5 | 0.031 | Mouse |
| 310 | 4276 | Elephant |
| 4.1 | 0.026 | Mouse |
| ... | ... | ... |
In this specific trivial example we’re not going to need a great deal of training data. Normally you need to be able to acquire “a lot” of training examples. The quotes are there because a lot is not well defined. There’s no magic number of examples, it might be ten examples or it might be a million that are necessary.
There is research into trying to persuade machines to learn with only a small number of examples. It must be possible because kids do it. You take your toddler to the farm and point them at a cow, a sheep and a pig. Next time you take them back they know which one is which or maybe you need to correct them once or twice. However you didn’t need to take them 50,000 times and show them a moo moo from every possible angle and under every lighting condition. However, with your regular machine learning system as it stands at the moment, a single example is going to be insufficient. A significant caveat should be applied to that statement because learning from only a few examples is an ongoing area of investigation and the technology might change very soon in some areas. We know it’s definitely possible to get it to work due to the evidence that humans are capable of performing the task. It’s just a matter of time before the machines catch up.
OK, so let’s put our data on a chart:
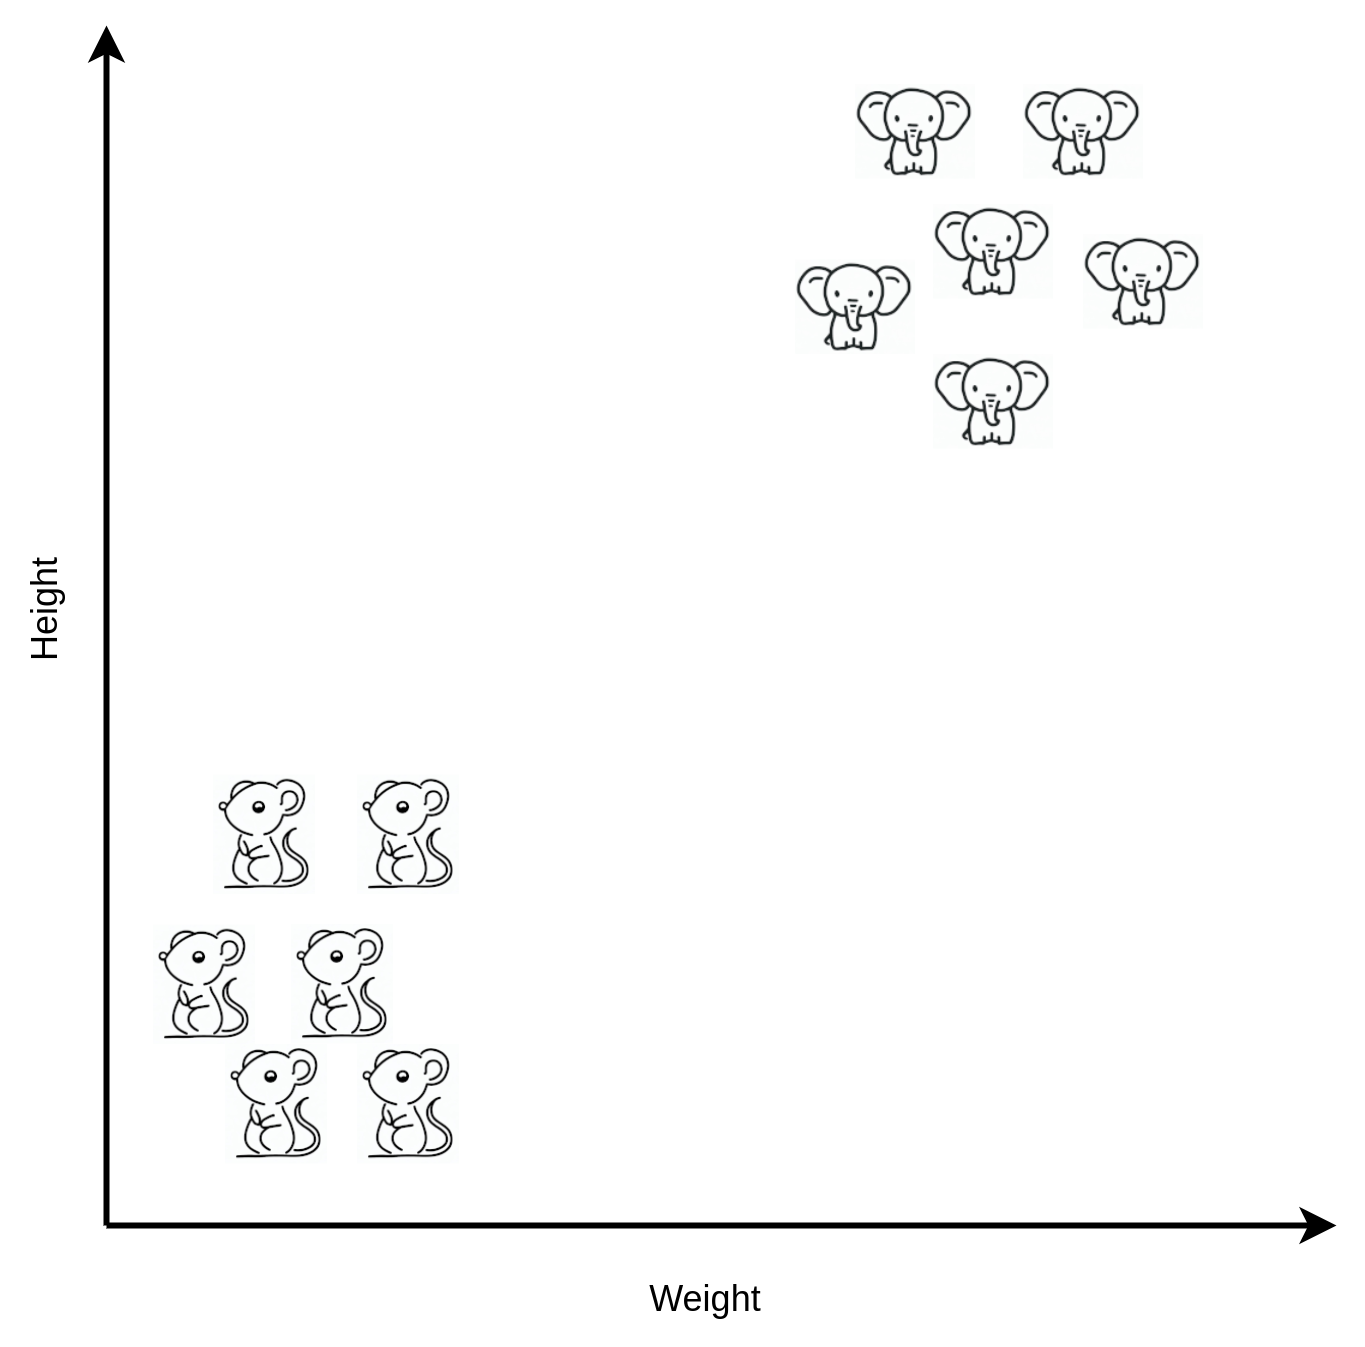
We can clearly see that elephants tend to be in the upper right of the chart and mice tend to be in the lower left of the chart. This is not surprising as elephants tend to be large and heavy and mice tend to be small and light.
We could draw an imaginary line dividing the two distinct regions of the chart (see below). What if I gave you some new measurements, but didn’t tell you what kind of animal they came from? The new example is very heavy and big. If I asked you to place that unknown animal on the chart it would end up near the top right.
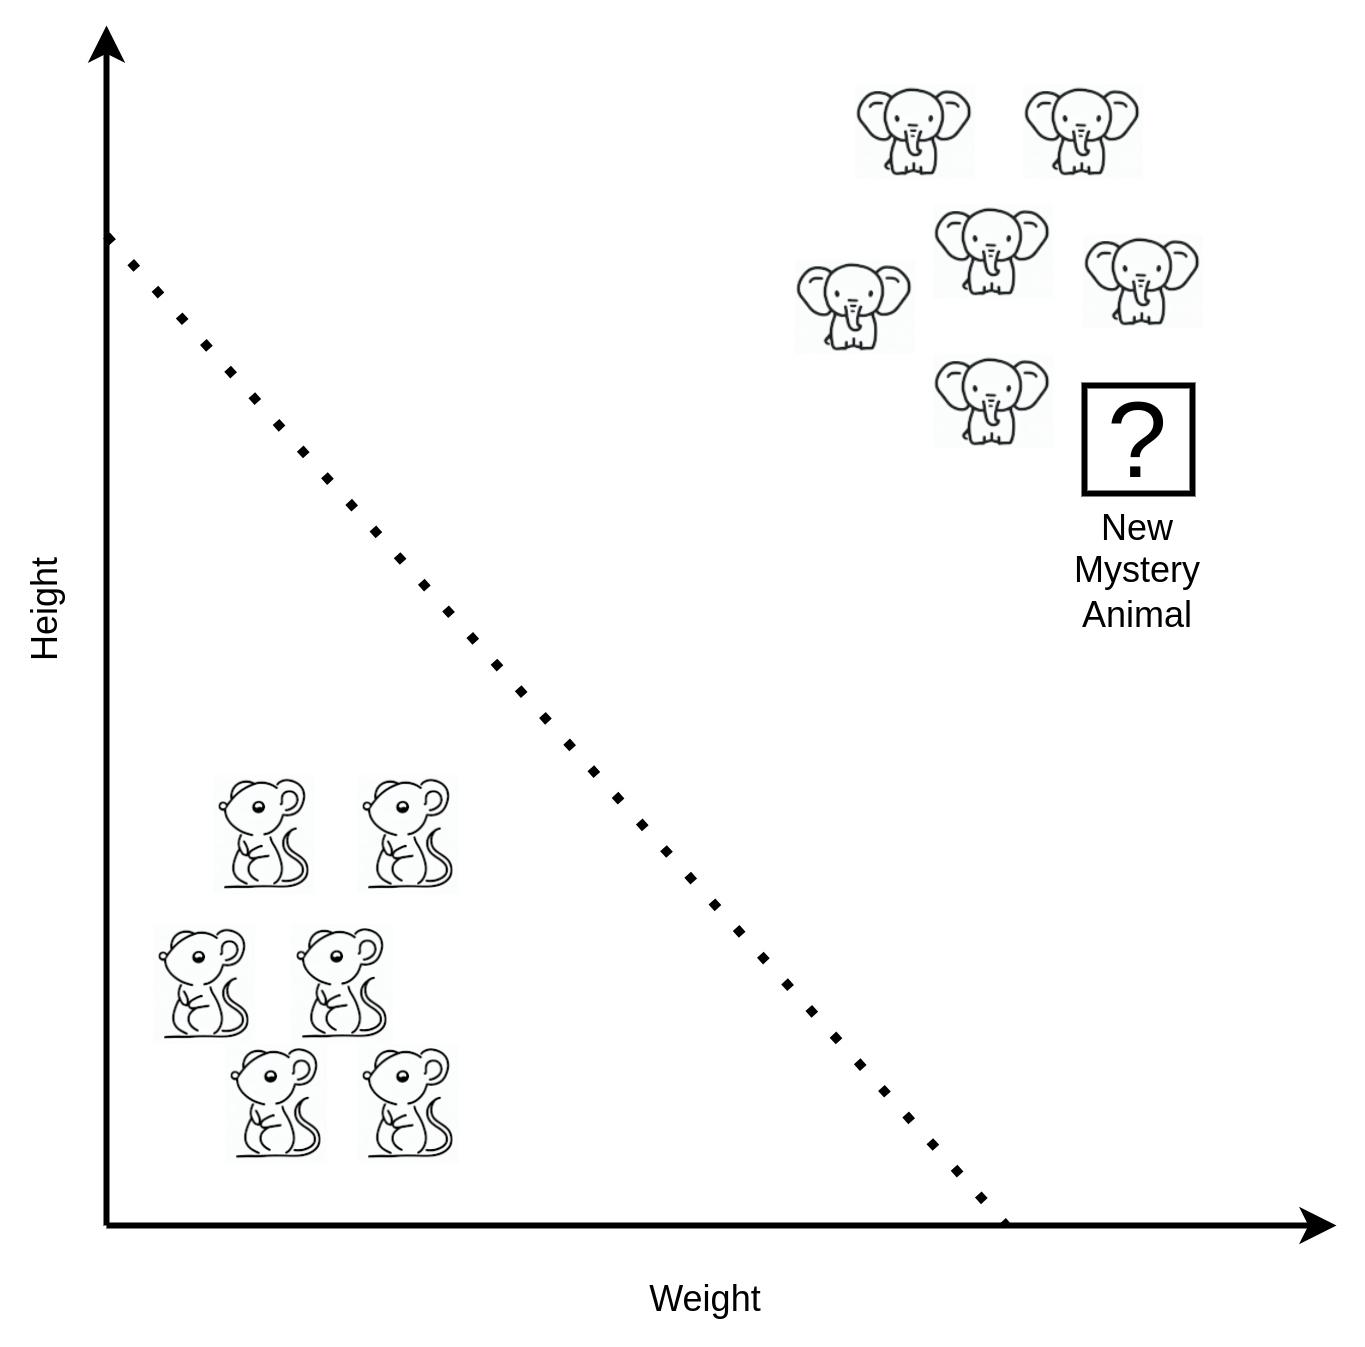
Given what else is around it in that region of the chart, we’re going to conclude it’s most likely an elephant. What we just did there is called “inference” and AI can do that for us. Instead of needing to manually inspect the chart, a machine can examine the nearby examples and draw a conclusion as to which group the new example is most similar to. That’s quite a useful capability as if we had a million sets of measurements we needed to classify as elephant or mouse, the machine can do the job for us in seconds whereas it would take forever by hand.
The way the machine is working is roughly what you did in your head. It draws a line on the chart and if the measurement is to the right of the line, it’s an elephant and if the measurement is to the left of the line it’s a mouse. “Machine learning” is the process of getting the computer to automatically decide where to draw the line on the chart by itself, without human involvement. In AI parlance, the dividing line that results from machine learning is known as a “model” as it represents or models the data.
The dividing line doesn’t have to be a straight line either, there are different classes of machine learning algorithms. I’ve listed those main classes here using the genuine formal mathematical nomenclature:
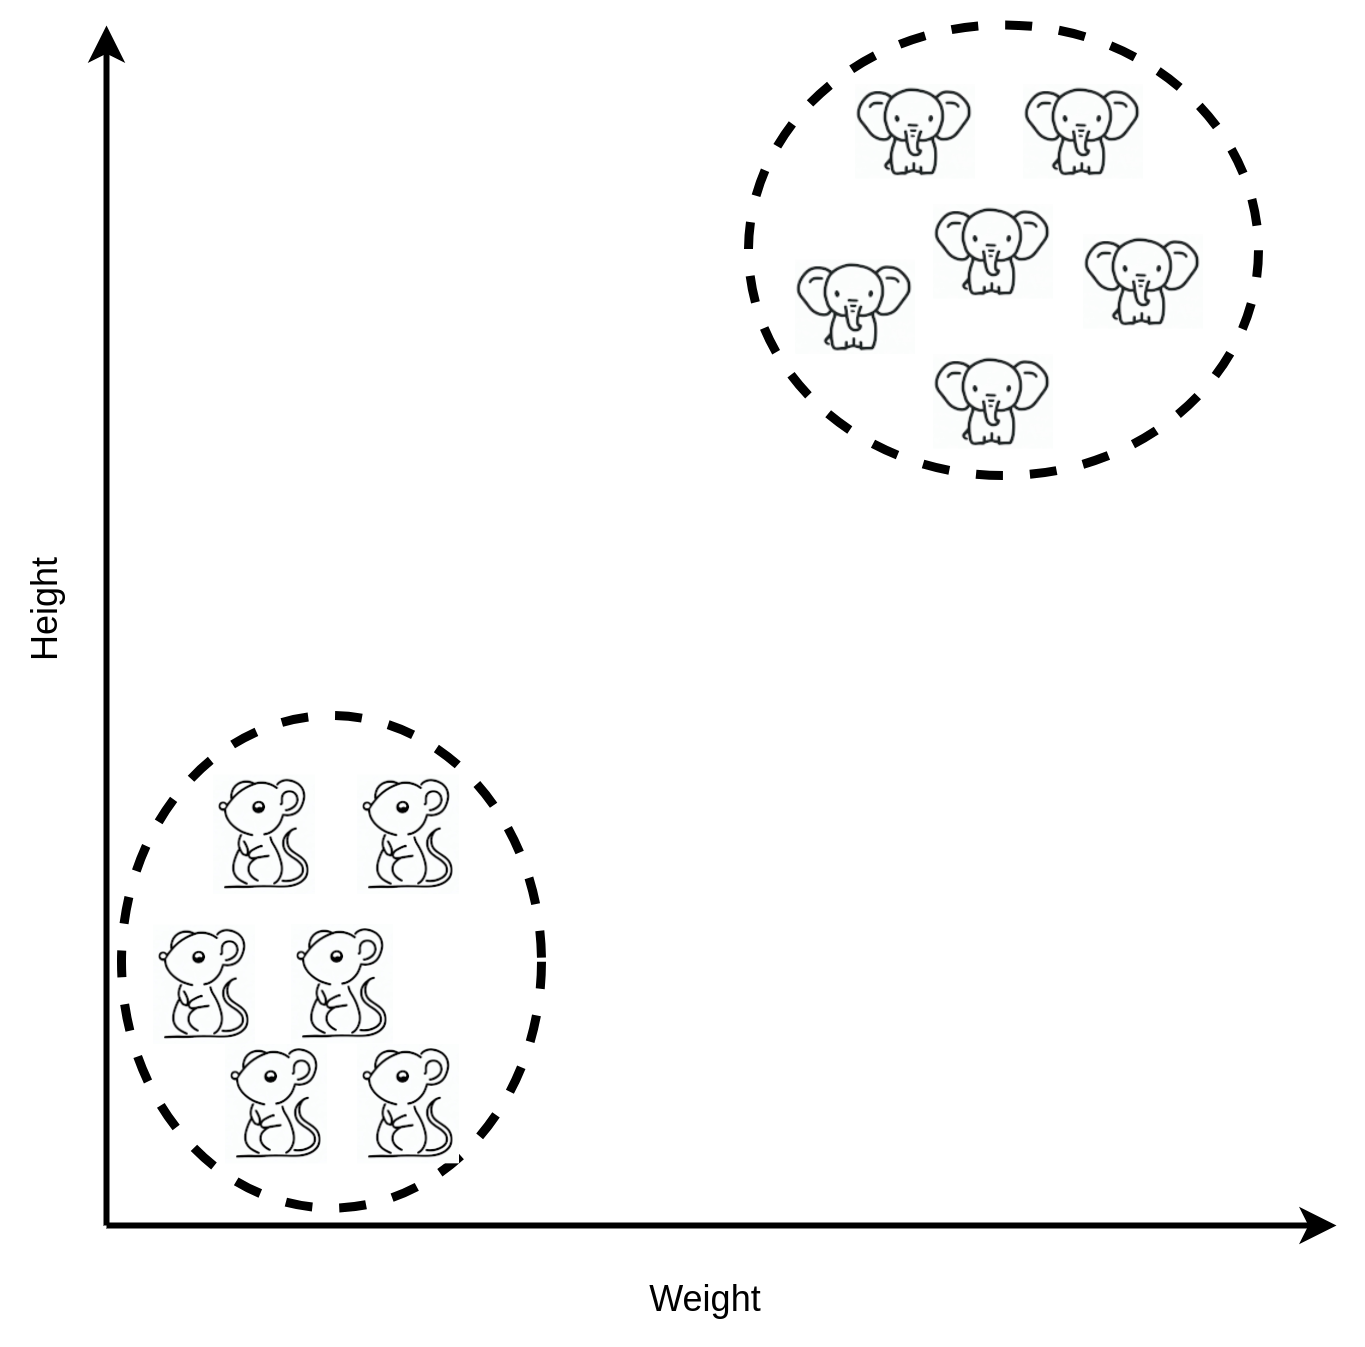
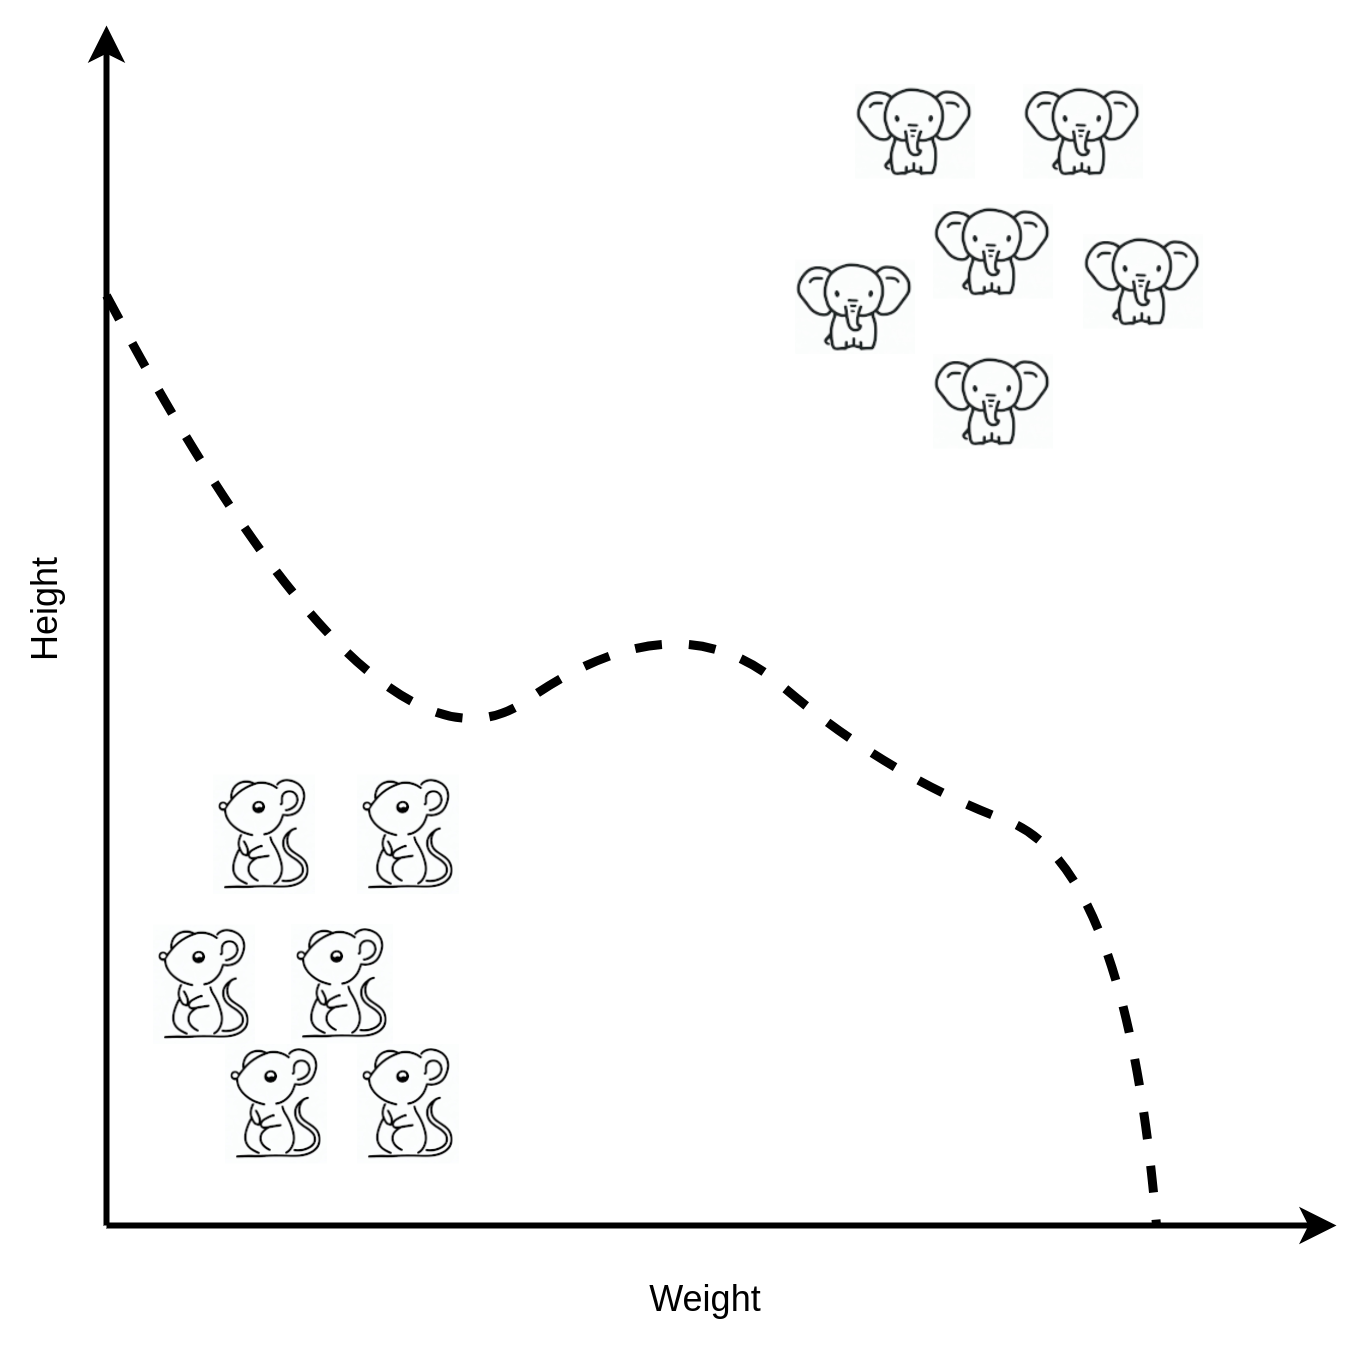
The machine learning system that can draw a wavy line (or estimates a nonlinear function is perhaps how a mathematician may put it) seems more capable than the one that can only draw straight lines. The elephants and mice may not appear on the chart such that a straight line can easily go between them. A curved line can go around corners and bend into a more complex shape that can weave and thread between awkward data points. Being able to lasso a section of the chart seems as if it should be even more capable still. However, it’s not so straightforward to decide that any one of these techniques is necessarily better than another. Firstly, there are often clever mathematical ways of avoiding the problem. The data may be rearranged such that the apparently less capable straight line drawer can actually solve the problem when it seems only a wavy line will do the job. Secondly, the different types of separation have differing costs and benefits.
One reason why we might want to use one method over another is inference performance. If you expect to need to test a million data items per day but your inference takes even a second for a computer to process, that could be an issue as there are only 86,400 seconds in a day and you would never be able to get through the million data items. The lasso algorithm (or “nonparametric” might be the maths description) may seem initially attractive but the straight line drawer is actually vastly faster when you have a lot of inference to do. The counterpoint though is the reliability of the response of the algorithm to the problem. The lasso style method can give better quality answers when there is not much training data available, which might be preferred in some situations even though the performance is slower. So there are swings and roundabouts to consider, it’s not just a simple case of one machine learning algorithm being obviously superior to any other.
As well as these broad classes of machine learning there are different subtypes within the classes. Deciding which one is optimal is a black art. Sometimes choices can be driven by the kinds of inputs the machine learning algorithm accepts or what kinds of output it can produce. For example some algorithms only really deal with binary true/false inputs, some deal with continuous numbers and some with selections from a list (labels). However, there’s usually some clever way to bend the inputs you have into what an algorithm can accept. You can often get any data into any algorithm somehow with enough thought.
For example, say you have a machine learning algorithm that can only accept true or false binary inputs, but your data contains categories like “elephant” and “mouse”, what can be done is turn each category into a binary choice. Is it an elephant? True or false. Is it a mouse? True or false. Is it a squirrel? True or false, etc. So the way the data is presented can be modified to fit the algorithm.
Some algorithms don’t like missing values. For example, say you were able to measure a specific elephant’s height but it was giving trouble when you tried to measure its weight and it stormed off. With some algorithms you can feed in just the height without the weight and it can still use the training data item provided there are at least some other examples where the weight is present. Other algorithms can’t handle that situation which makes the algorithm useless where there is only patchy training data. Some algorithms are more resilient to errors in the data (noise) but others are not very tolerant of errors at all, preferring clean and accurate training data. If you have one person on your elephant measuring team who does not know how to use a tape measure, that could be a problem as there will be mistakes in the data.
Sometimes the algorithm choice might be based on the outputs. A system may only be able to make a single decision (it’s an elephant or a mouse and never both) but other algorithms may permit the output to have more than one category. The data looks mostly like an elephant but there is always the outside possibility it could be a mouse, I’ll give you a 95% probability it’s an elephant and a 5% chance it’s a mouse. The algorithm might be able to handle hierarchies of sub-categories, for example it’s an elephant, but within that category it’s an African elephant.
Then there’s the computational performance of training. The AI probably isn’t going to learn flawlessly the first time, in fact it may not even work at all. So you’re going to want to iterate through many experiments. It’s not uncommon for training on complex tasks with a lot of training data to take several days even on a very expensive and powerful machine. This is particularly so with video, image and audio tasks. If you have to wait several days between each iteration of your experiment, that really slows you down. If you imagine writing a computer program and each time you want to test the software it takes three days to get the error messages back, that’s going to make progress exceptionally slow going. An AI software developer is going to be able to work much more efficiently (and hence solve the business problem faster) with a well selected algorithm that trains quickly so they can iterate through all of the problems faster.
All of this AI stuff looks fairly simple, you just put the data on a chart and draw a line and that’s it. Why would you even need a machine at all? Well in this simple example you don’t, you can just look at the chart, the solution is obvious and you can program in a rule by hand. When machine learning becomes particularly useful is where it’s difficult for a human to see the answer to a problem.
The above chart has only two dimensions (height and weight) and two possible categories of animal to decide between. But with some problems we’re going to need many more dimensions. What if we added a third dimension? So maybe we’re going to add ear size as a third parameter to be measured to separate elephants and mice on the chart. This can still be visualised on a chart, just about, but now a dividing line has to be drawn in 3D space, which is tricky.
But what if we add length of tail. Now we’re up to four dimensional space. How do you represent four dimensions on a chart? So we have the X-axis, the Y-axis, the Z-axis and … ? Is that a hypercube? Perhaps it is something to do with a tesseract? How is a dividing line to be drawn now (see below)?
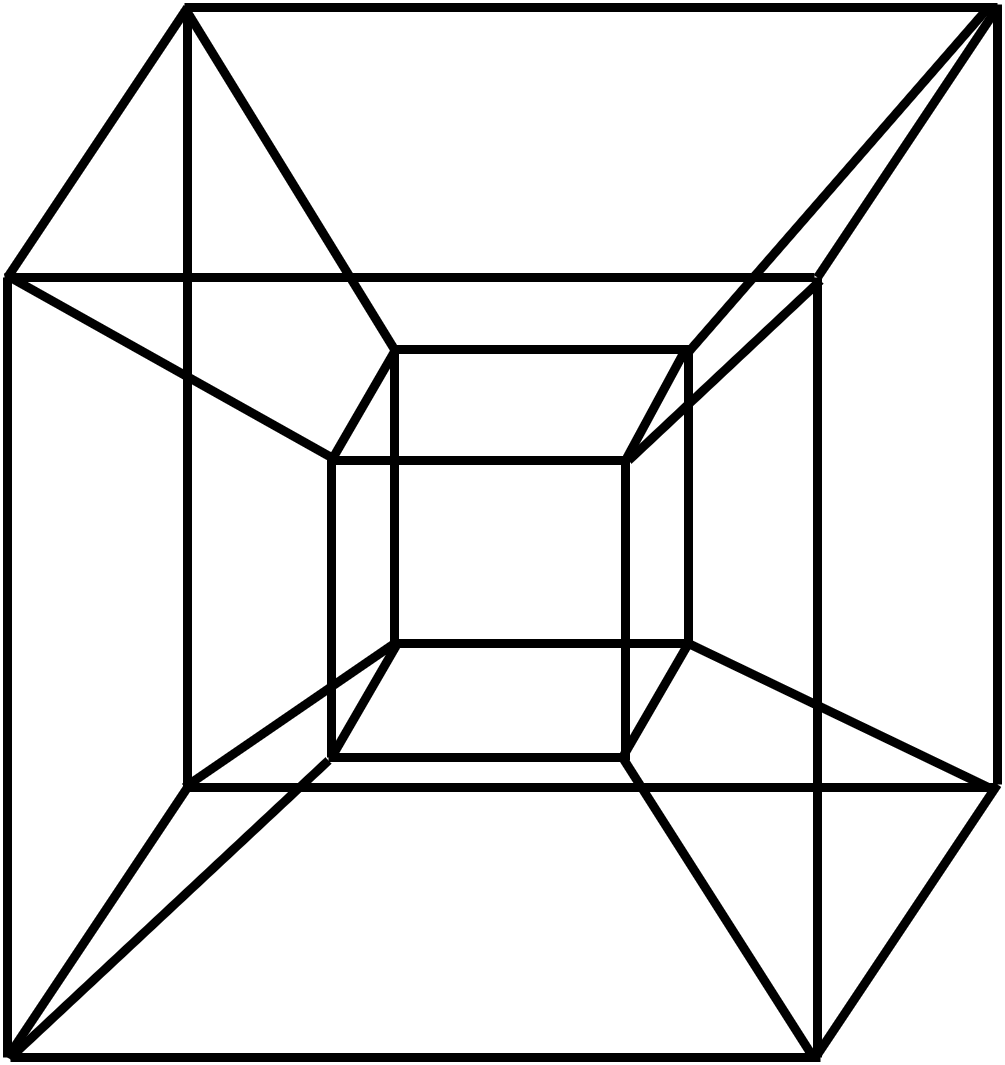
What about five dimensions? I have absolutely no idea how to draw a five dimensional chart so we’re going to need some help. This is where the machine learning comes in because unlike humans it can draw the dividing line in fairly well any number of dimensions. The fact that the machine can deal with very large numbers of dimensions allows us to do things that we would have a very difficult time figuring out on our own.
A task where the number of dimensions really starts increasing precipitously is when dealing with image data. Say we want to categorise pictures of elephants or mice instead of labelling them by measured characteristics. We go out and get our training data, that is thousands upon thousands of photos of elephants and mice, but how do you feed those pictures into a machine learning algorithm?
Imagine a greyscale photograph of 1000x1000 pixels. Traditionally the brightness of each pixel would be represented as a number between 0 and 255 because each pixel usually occupies one byte of memory, which can represent only that specific range of numbers. The 0 - 255 range of brightness values is usually sufficient to fool the human eye into thinking it is observing a continuous range of greys and is also a convenient range of numbers for a machine to work with.
Each pixel could be imagined as representing a dimension on a chart. The first pixel we encounter becomes the X-axis on the chart, the second pixel is the Y-axis, the third pixel is the Z-axis and so on up. With a 1000x1000 pixel image, then one million dimensions will be needed.
The data is not really conceptually much different to the chart of heights and weights, it’s just got considerably more dimensions. A million dimensions is well beyond the capability of a human to work out how to draw a dividing line. However, a machine learning algorithm can achieve this. One dimension or a million dimensions is all the same to a computer. The only issue with a large number of dimensions is how much computing power is required for the system to learn (draw the dividing line) and that is a problem that can get out of hand. With a million dimensions, many calculations needed per dimension and perhaps a 100,000 items of training data, the requirements for machine learning might stretch the capability of the available computer. A machine can certainly be easily found that can tackle a task of this magnitude but machine learning becomes either slow or expensive (take your pick). There are, however, methods of improving the situation.
Audio data can be considered just a series of dimensions as well. You may have seen an oscillogram or waveform representation of an audio signal (see below):

The Y-axis of the oscillogram is the amplitude of the audio signal, which is a representation of the position of the speaker cone. This can move in one dimension, either backwards or forwards. The X-axis represents time. The waveform is broken down into samples. Often 44,100 samples per second is considered the magic number for acceptable audio fidelity for music, hence there are this number of positions along the X-axis per second of audio. There are also a distinct number of steps in amplitude, usually 65,536 is considered acceptable to produce reasonable audio quality. Hence, there are this number of possible distinct positions for the speaker cone.
In an audio signal, the first sample could be the first dimension on the machine learning chart, the 2nd sample the 2nd dimension and so on. It quickly becomes apparent though that this is going to result in a lot of dimensions for any reasonable length of audio. A typical three minute song would be nearly 8 million dimensions, and that’s only in mono. Often it will be the case that some trick is applied to reduce the number of dimensions before machine learning is attempted. The audio will likely be mathematically simplified before presentation to a machine learning system.
If the intent is to recognise the genre of a song, aspects of the beat or melody may be examined as opposed to the complete waveform of the music. That might be good enough to do the job. The beat of a piece of audio can be easily extracted with conventional mathematical techniques and no machine learning is needed. Beat detectors are often available even on quite simple audio equipment. If the time between beats is presented as the input, there are perhaps two beats per second in a typical song and in a three minute song there are now only 360 items of information (beat timings) to be dealt with instead of 8 million items.
The process of extracting just what we need from the original data is called “feature extraction” and can massively reduce the number of dimensions down to a manageable level. Feature extractors are common where there is complex input data that might result in a lot of dimensions. Feature extractors on images might perform edge detection, which looks for sharp contrasts. An edge detector is a commonly seen image effect that produces an output from a photograph that looks somewhat like a cartoon.
Another useful process to help reduce computation is dimensionality reduction. This attempts to reduce the number of dimensions whilst still retaining most of the original meaning in the data. A simple way to think about this is scaling down an image, which reduces the number of pixels in it and therefore the number of dimensions that need to be input to the machine learning system. In fact, scaling down an image is a common preprocessing step to reduce the cost of machine learning. The image is still recognisable even at a size significantly smaller than the original.
There are statistical methods that can work on many forms of data and effectively try and scale down the number of dimensions in the data sets whilst still ensuring that what the data set represents still resembles (in a mathematical sense) the original data. One common technique is called “principal component analysis.” With fewer dimensions it can be much quicker to perform machine learning.
Computer hardware is getting faster and faster and what is easily possible now would have been an incredible feat only a few years ago. Machine learning can increasingly just deal with very complex data sets up-front without requiring much pre-work and figure out the whole thing itself. However, the tasks researchers are going to want to attempt will always push the boundaries of what affordable hardware can do. There is always more data with greater fidelity and ever larger numbers of dimensions. Equally the consumer is going to hope to run sophisticated AI techniques on exceptionally cheap throw-away hardware with minimal computational capability. First the consumer expected a £20 doorbell to contain a wireless camera. Now the consumer wants the £20 camera to automatically detect an approaching courier so they never miss a delivery (how they get the courier detecting camera delivered in the first place I am not sure). For these reasons the statistical dimensionality reduction methods will probably remain relevant for some time.
There are dozens upon dozens of machine learning algorithms. There is the exotic sounding “support vector machine”, a straight line drawer, and there is k-NN, which is a lasso type algorithm. Implementations of all of these algorithms are now easy to find for popular programming languages. One particular wavy line drawer is currently a particular favourite with AI researchers though and deserves a chapter of its own - the neural network.